In this article, we’ll answer the question, “What is an isoline map?” and delve into how these maps work and their significance in fields like geography and meteorology. An isoline map connects points of equal value, such as elevation, temperature, or pressure, to provide clear visual representations of spatial data.
We’ll also explore examples and practical use cases to demonstrate their importance in analyzing patterns and gradients. For a deeper understanding of other visualization techniques, such as choropleth maps, check out our guide on what is a choropleth map.
What is an Isoline Map?
An isoline map is a cartographic tool that connects points of equal value to represent data gradients across a geographic area. It uses isolines—lines that join locations with the same measured quantity—to illustrate variations such as:
- Elevation (contour lines)
- Temperature (isotherms)
- Pressure (isobars)
What are Isolines?
Isolines are the foundation of isoline maps, highlighting where values like altitude or temperature remain constant. They transform numerical data into visual patterns, making trends and gradients easy to interpret.
In simpler terms, isolines tell a visual story, revealing patterns hidden in raw data. From scientific analysis to practical uses like urban planning, isoline maps simplify complex information and provide clarity.
Types of Isoline Maps
At Geoapify, we offer advanced tools to help you create various types of isoline maps, tailored for different applications. Here are the most common types and how they can be used:
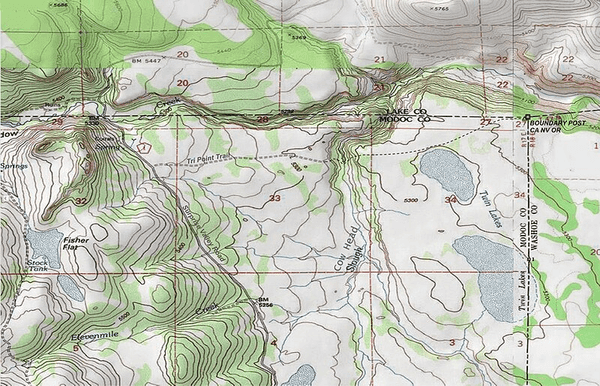
Contour Maps
Contour maps connect points of equal elevation, offering a clear view of terrain. They are essential for topographic analysis, outdoor activities, and land-use planning.
Isotherms
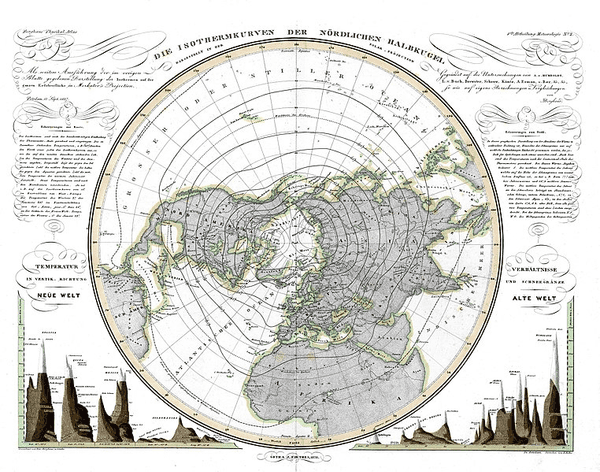
Isotherms connect points of equal temperature, providing insight into temperature distribution. These maps are widely used in weather forecasting and climate research.
Isobars
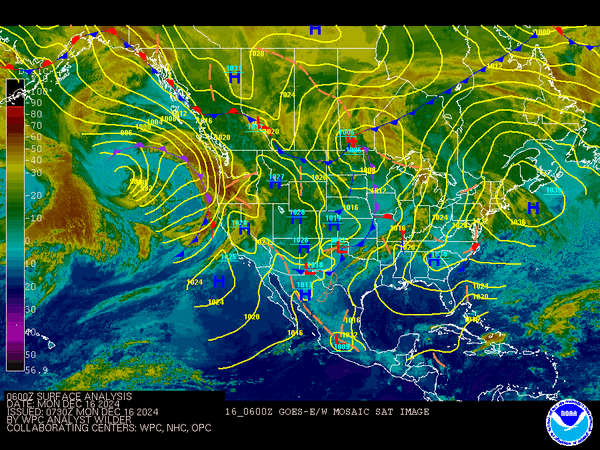
Isobars connect points of equal atmospheric pressure and are essential for understanding weather systems and forecasting storms.
Isochrones
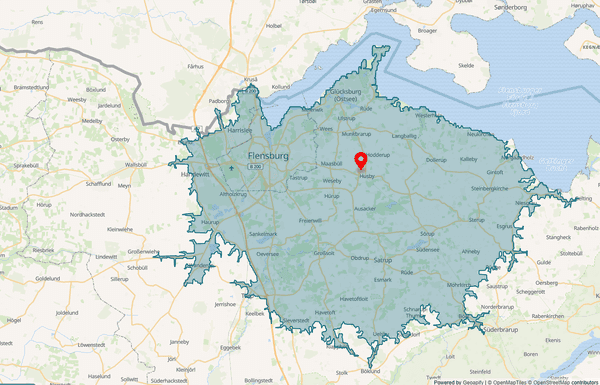
Isochrone maps show areas reachable within a specific time from a given location. Widely used in urban planning, logistics, and transportation, they help analyze accessibility and optimize routes. With our Geoapify Isochrone API, you can effortlessly create travel-time maps for your projects.
Isodistances
Isodistance maps highlight locations equidistant from a specific point, making them ideal for distance-based planning, catchment area mapping, and geospatial analytics. Our Geoapify Isodistance API simplifies the process, helping you create these maps with ease.
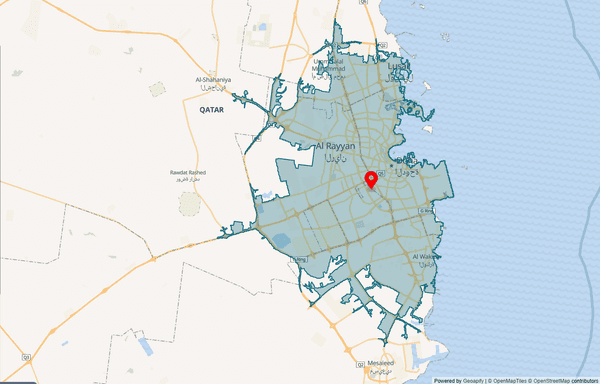
At Geoapify, we provide powerful APIs that enable you to generate isoline maps tailored to your unique needs. Whether you’re working on travel-time analysis, route optimization, or accessibility planning, our tools make it easy to visualize and analyze spatial data. Learn more about our Isochrone Maps and Isoline APIs to get started today!
Isoline Maps Examples and Use Cases
Isoline maps are widely used across different fields to visualize spatial data and reveal patterns that would otherwise be difficult to analyze. Here are some key examples and their real-world applications:
Geography
An isoline map example in geography is a contour map that connects points of equal elevation. These maps are essential for understanding the shape of landscapes, identifying mountains, valleys, and slopes, and aiding in navigation and land-use planning. Another common example is weather maps that use isotherms to represent areas of equal temperature and isobars to show atmospheric pressure. These isoline maps help meteorologists predict weather patterns and identify storm systems.
Urban Planning
In urban planning, isoline maps are used to analyze travel time and reachability. An isochrone map is a perfect isoline map example that shows areas reachable within a specific time frame, such as 30 minutes from a city center. These maps are valuable for optimizing transportation networks, analyzing public transit efficiency, and improving accessibility for residents. Planners often use isoline maps to identify gaps in infrastructure and design better routes for commuters.
Environmental Studies
Isoline maps are also widely used in environmental studies to map pollution, resource distribution, or other environmental factors. For instance, isolines can represent levels of air pollution across a city, helping policymakers identify critical areas that require intervention. Similarly, isoline maps are used to track groundwater levels, soil quality, or noise pollution, providing a clear visual representation for analysis and decision-making.
What Are Isoline Maps Used For?
Isoline maps are used to simplify complex numerical data, making it easier to identify trends and patterns across a geographic area. From analyzing travel times and predicting weather to mapping environmental changes, isoline maps are an invaluable tool for professionals across fields like geography, urban planning, and environmental science.
For instance, an isoline map example in urban planning could be an isochrone map showing how far someone can travel within 30 minutes, helping optimize public transportation systems and accessibility. In environmental studies, isolines can highlight areas with high pollution levels, aiding in targeted cleanup efforts and resource allocation. If you’re interested in learning more about creating travel-time maps for public transport, check out our guide on how to make travel-time maps.
By transforming raw data into intuitive visuals, isoline maps empower decision-makers to address real-world challenges with actionable insights.
How to Build an Isoline Map
Creating an isoline map involves tools and techniques that have evolved significantly over time. From manual methods to advanced digital tools, isoline maps have become more accessible and accurate. Here’s an overview of how to build an isoline map:
Manual Methods
Historically, isoline maps were drawn manually using data collected through surveys and measurements. Cartographers would plot points of equal value, such as elevation or temperature, and connect them to form isolines. While this method provided valuable insights, it was labor-intensive, prone to errors, and lacked the precision that modern tools offer.
Digital Tools
Today, digital tools make building isoline maps faster, more accurate, and highly customizable. Geographic Information Systems (GIS) software, such as QGIS or ArcGIS, allows users to input data, generate isolines, and customize visual outputs. These tools are widely used by professionals in geography, urban planning, and environmental science.
Another efficient way to build isoline maps is through APIs. For example, the Geoapify Isoline API allows users to create isoline maps quickly and effortlessly. With a few API calls, you can generate isochrones for travel time analysis or isodistance maps for distance-based planning. Geoapify also provides a detailed guide on drawing isolines with Leaflet and GeoJSON, offering step-by-step instructions for beginners and advanced users.
Key Considerations for Building Isoline Maps
- Data Sources: Accurate isoline maps rely on reliable data. For elevation maps, digital elevation models (DEMs) are commonly used, while weather isolines require temperature or pressure data from meteorological sources.
- Accuracy: The precision of isolines depends on the resolution of the data and the method used to interpolate values between measured points.
- Purpose and Visualization: Choose the right tool and scale depending on the purpose of the isoline map. For example, urban planners might need detailed isochrone maps, while environmental scientists may focus on broader trends using pollution maps.
By leveraging modern tools like GIS software and APIs such as Geoapify, creating isoline maps has become simple, efficient, and adaptable to various real-world applications. Whether you’re analyzing travel times, mapping elevation, or visualizing environmental data, isoline maps are essential for transforming complex information into actionable insights.
Geoapify’s Solutions to Create Isoline Maps
Geoapify offers robust tools and APIs to help you create isoline maps tailored to your needs. Whether you’re building isochrone maps for travel-time analysis or isodistance maps for geospatial planning, Geoapify provides powerful and easy-to-use solutions.
Isochrone API
The Isochrone API allows you to create travel-time maps that visualize accessibility within a specified time frame. These maps are perfect for:
- Urban Planning: Analyze how far people can travel within a specific time frame from a city center or key location.
- Logistics: Optimize delivery routes by identifying reachable areas within certain time limits.
- Service Area Analysis: Define catchment areas for businesses, hospitals, or public services to better understand accessibility.
Isodistance API
With the Isodistance API, you can generate maps showing areas equidistant from a central point. These maps are ideal for:
- Location-Based Studies: Identify zones around a facility, such as stores, schools, or service points.
- Route Planning: Visualize distances to improve travel efficiency and coverage.
Customizable Outputs
Geoapify’s APIs provide customizable options to suit your specific needs. You can adjust parameters such as:
- Travel Mode: Choose from driving, walking, cycling, or public transport.
- Time and Distance: Define how far or how long to calculate the isolines.
- Visualization: Output maps in various formats compatible with mapping platforms like Leaflet and Mapbox.
Ease of Integration
Geoapify’s APIs are designed for seamless integration with popular tools, platforms, and workflows. This allows developers, planners, and analysts to efficiently create isoline maps without extensive technical expertise.
To get started, explore the Geoapify Isoline API for customizable isoline map creation, or learn more about real-world applications on the Isochrone Maps page. With Geoapify’s solutions, you can transform complex geospatial data into meaningful insights quickly and easily.
FAQ
What is the difference between isochrones and isolines?
While both isochrones and isolines visualize data using lines, they represent different concepts. Isolines connect points of equal value, such as elevation, temperature, or pressure. Isochrones are a specific type of isoline that display areas reachable within a specific time frame, such as showing how far someone can travel in 30 minutes.
Can isoline maps be used for public transportation planning?
Yes, isoline maps are highly valuable for public transportation planning. Isochrone maps, for instance, help planners analyze travel times from bus stops, train stations, or metro hubs. This information can optimize routes, identify coverage gaps, and improve overall accessibility for commuters.
What tools can I use to create isoline maps?
There are several tools available to create isoline maps. Popular options include GIS software like QGIS and ArcGIS, which allow precise isoline generation. Additionally, APIs such as the Geoapify Isoline API make it easy to build isochrone and isodistance maps by customizing travel modes, distances, and time parameters.
How can I display isoline maps on a website using JavaScript?
You can display isoline maps on a website using JavaScript libraries like Leaflet or Mapbox combined with GeoJSON data. Geoapify's APIs allow you to generate isolines in GeoJSON format, which can then be integrated into interactive maps. For a step-by-step guide on working with GeoJSON and JavaScript, check out our GeoJSON JavaScript Developer Guide.
Conclusion
Isoline maps are powerful tools for visualizing spatial data, offering a clear way to analyze patterns in elevation, travel times, weather, and more. Their versatility makes them invaluable across a wide range of fields, from geography and urban planning to environmental studies.
Geoapify provides robust and customizable solutions to help you create isoline maps tailored to your needs. With our Isoline API, you can effortlessly build isochrone and isodistance maps for travel-time analysis, route optimization, and geospatial planning.
Ready to get started? Explore our Isochrone Maps page or contact us to see how Geoapify can help you save time and unlock valuable insights with isoline mapping.
