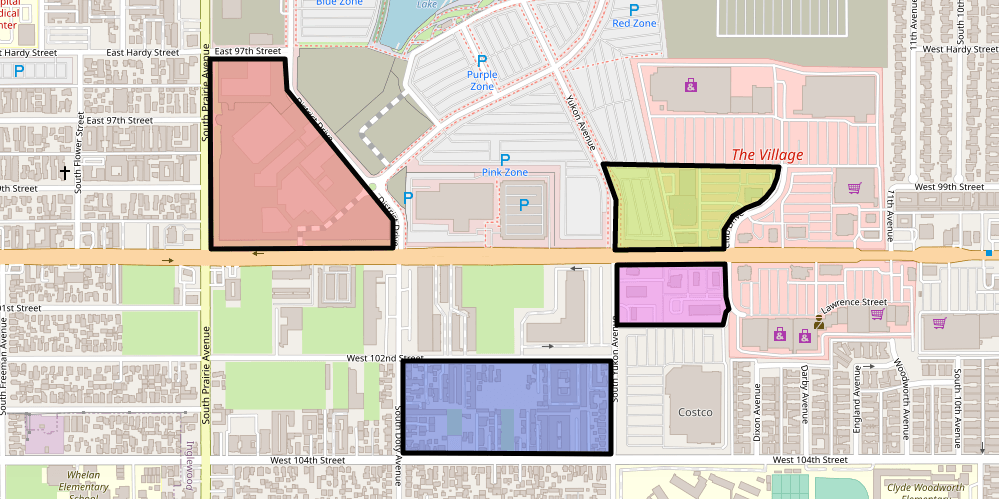
Static maps allow you to easily add a map to your website or app as a regular image. So using them is useful when you just want to display a map and don't need any interactivity.
The required map image is generated dynamically on a server. In addition, you can add markers and shares to highlight some areas and places. This tutorial will review how to use Static Maps and set its parameters to achieve the desired results.
Choose a Static Map view
The first thing you need to set when generating a static map is the map image size. Here are the parameters you use for this:
| Parameter | Description | Example |
|---|---|---|
| width | Static map width in pixels | width=640 |
| height | Static map height in pixels | height=460 |
You can choose from several map styles. Use the style parameter to select one:
| Parameter | Description | Example |
|---|---|---|
| style | Map style | style=osm-bright-grey |
You can choose among several options for your map view - let the algorithms determine the view automatically, trying to fit the provided markers and shapes, or define the map explicitly with the parameters:
| Parameter | Description | Example |
|---|---|---|
| area | An area that should be visible on the map | area=rect:-84.2772,33.7865,-84.2435,33.7712 |
| center + zoom | The map center and zoom | center=lonlat:-122.685464,45.5130378&zoom=15 |
Adding markers to a map
You can add single or multiple markers to the map with the markers parameter. When adding more than one marker, use a pipe character (|) to separate each definition:
| Parameter | Description | Example |
|---|---|---|
| marker | Markers separated by | | marker=lonlat:-122.299807,47.526808|lonlat:-122.305944,47.523674;color:%23bb3f73;size:x-large |
You can change marker icons' color, shape, and content by editing their properties. See the Static Maps documentation for details and examples.
Drawing shapes on a map
You can draw shapes (circles, rectangles, and so on) on a static map with the parameters:
| Parameter | Description | Example |
|---|---|---|
| geometry | circle, rectangle, polyline, or polygon objects separated by the "|" character | geometry=circle:-73.044725,40.633252,10;linewidth:3;linecolor:%23ff44ff;fillcolor:%2344ffff |
| geojson | URL-encoded GeoJSON Feature or FeatureCollection object | geojson=%7B%22type%22%3A%22Feature%22%2C%22 properties%22%3A%7B%22linecolor%22%3A%22%23000000%22%2C%22linewidth%22%3A5%2C%22 lineopacity%22%3A1%2C%22fillcolor%22%3A%22%234b68dd%22%2C%22 fillopacity%22%3A0.5%7D%2C%22geometry%22%3A%7B%22type%22%3A%22 Polygon%22%2C%22coordinates%22%3A%5B%5B%5B-118.339694%2C33.943600 %5D%2C%5B-118.33969%2C33.941953%5D%2C%5B-118.33523%2C33.941944%5D%2C% 5B-118.33522%2C33.94360%5D%2C%5B-118.339694%2C33.943600%5D%5D%5D%7D%7D |
Please note that because of limitations on URL lengths, URL-encoded GeoJSON strings are also limited.
For more details on the structure and visualization properties of geometries, see the Static Map Documentation page.
Customizing Map Style
Geoapify's Static Maps API allows you to customize the appearance of your maps to fit your application's design requirements. You can adjust various visual aspects such as colors, labels, and map features.
| Parameter | Description | Example |
|---|---|---|
| styleCustomization | The parameter lets you define the visual style of different map elements. This parameter allows you to specify styles for various map features using a series of key-value pairs separated by "|" | styleCustomization=background:%23d2cebf|landcover_grass:%2391a273 |
The exact styling options depend on the map style you are using. To make customization easier, Geoapify provides the Static Map Playground, a graphical user interface (GUI) where you can interactively change the map style and get the corresponding styleCustomization parameters. This tool allows you to visually adjust the map's appearance and copy the generated parameters directly into your API request.
Static Map examples
To use Geoapify Static Maps, you need a Geoapify API key. You can register and generate one by yourself on the Geoapify MyProjects page.
- using the center and zoom parameters to define the map view:
https://maps.geoapify.com/v1/staticmap?style=osm-liberty&width=600&height=400¢er=lonlat:-122.685464,45.5130378&zoom=15&pitch=52&bearing=54&apiKey=YOUR_API_KEY- using the area parameter to define the map view:
https://maps.geoapify.com/v1/staticmap?style=osm-liberty&width=600&height=400&area=rect:-84.2772,33.7865,-84.2435,33.7712&apiKey=YOUR_API_KEY- add a marker in the map center:
https://maps.geoapify.com/v1/staticmap?style=klokantech-basic&width=600&height=400&marker=lonlat:15.076032674463988,37.50450761142886;type:awesome;color:%23408ed7;size:x-large;icon:h-square;whitecircle:no&apiKey=YOUR_API_KEY- add multiple markers:
https://maps.geoapify.com/v1/staticmap?style=klokantech-basic&width=600&height=400&marker=lonlat:15.076032674463988,37.50450761142886;type:awesome;color:%23408ed7;size:x-large;icon:h-square;whitecircle:no|lonlat:15.076094476565743,37.5117317930609;type:awesome;color:%23408ed7;size:x-large;icon:h-square;whitecircle:no|lonlat:15.06022542074038,37.50748071337533;type:awesome;color:%23408ed7;size:x-large;icon:h-square;whitecircle:no|lonlat:15.05242096705527,37.51107144705128;type:awesome;color:%23408ed7;size:x-large;icon:h-square;whitecircle:no|lonlat:15.068758290102267,37.51028727857664;type:awesome;color:%23aaafb4;size:large;icon:h-square;whitecircle:no|lonlat:15.067301458747664,37.50673778139405;type:awesome;color:%23aaafb4;size:large;icon:h-square;whitecircle:no|lonlat:15.059028737841913,37.5014957734128;type:awesome;color:%23aaafb4;size:large;icon:h-square;whitecircle:no|lonlat:15.053669679644344,37.5050867949646;type:awesome;color:%23aaafb4;size:large;icon:h-square;whitecircle:no|lonlat:15.074637645211197,37.50013361660724;type:awesome;color:%23aaafb4;size:large;icon:h-square;whitecircle:no|lonlat:15.069018438558373,37.5028579053683;type:awesome;color:%23aaafb4;size:large;icon:h-square;whitecircle:no&apiKey=YOUR_API_KEY- add circles to the map:
https://maps.geoapify.com/v1/staticmap?style=osm-bright-grey&width=600&height=400&geometry=circle:7.445297742419882,46.948361872425124,30;fillcolor:%23f9a9eb;fillopacity:0.5|circle:7.438301614578734,46.94649487478634,20;fillcolor:%23293a77|circle:7.441672476175171,46.94811873223475,100;fillcolor:%236ded83;fillopacity:0.5&apiKey=YOUR_API_KEY- add rectangles to the map:
https://maps.geoapify.com/v1/staticmap?style=toner-grey&width=600&height=400&geometry=rect:-0.3735794501762939,39.46012847701809,-0.32031815564982935,39.48224631549971;fillcolor:%23ff8737|rect:-0.3881691777199876,39.44533409789409,-0.3698880733277292,39.45863560890271;linecolor:%2300afff;linewidth:5;linestyle:dashed&apiKey=YOUR_API_KEY- add polylines and polygons to the map:
https://maps.geoapify.com/v1/staticmap?style=positron&width=600&height=400&geometry=polyline:-77.81882286071777,34.27218359557089,-77.8165054321289,34.26977200698157,-77.81418800354004,34.26821153044989,-77.81161308288574,34.26686382286875,-77.80929565429688,34.267502213362675,-77.8066349029541,34.26792780433297,-77.80345916748045,34.26806966751108,-77.7996826171875,34.26821153044989,-77.79487609863281,34.26906270305702,-77.7912712097168,34.270126656700164,-77.78895378112793,34.27104873896822,-77.78800964355467,34.270977809921966,-77.78500556945801,34.26941735576717,-77.78148651123047,34.267147552575445,-77.7788257598877,34.26516142452615,-77.77599334716797,34.26310431388478;linewidth:5;linecolor:%23eb44ea|polygon:-77.80212879180907,34.26303337813771,-77.79882431030273,34.26140183944268,-77.79448986053467,34.265374226203555,-77.795090675354,34.26583529465743,-77.79590606689452,34.26654462580447,-77.79654979705809,34.26672195765641,-77.7971076965332,34.26526782543215,-77.79839515686035,34.264061940615136,-77.79942512512207,34.26352992711102,-77.8001546859741,34.26356539478267,-77.80066967010498,34.26399100567567,-77.80092716217041,34.264168342912114,-77.80152797698975,34.263671797707836,-77.80212879180907,34.26303337813771;fillcolor:%23d6ff00;fillopacity:0.7&apiKey=YOUR_API_KEY- add more complex shapes as GeoJSON:
https://maps.geoapify.com/v1/staticmap?style=osm-bright&width=600&height=400&geojson=%7B%22type%22%3A%22Feature%22%2C%22properties%22%3A%7B%22fillcolor%22%3A%22%23488ca6%22%2C%22fillopacity%22%3A0.6%7D%2C%22geometry%22%3A%7B%22type%22%3A%22Polygon%22%2C%22coordinates%22%3A%5B%5B%5B-118.368072%2C33.928548%5D%2C%5B-118.36910%2C33.918292%5D%2C%5B-118.37013%2C33.90347%5D%2C%5B-118.366355%2C33.894642%5D%2C%5B-118.358459%2C33.88865%5D%2C%5B-118.348503%2C33.880677%5D%2C%5B-118.3382034%2C33.870130%5D%2C%5B-118.32893%2C33.86613%5D%2C%5B-118.311424%2C33.86072%5D%2C%5B-118.29219%2C33.8610%5D%2C%5B-118.28670%2C33.858157%5D%2C%5B-118.2863%2C33.86129%5D%2C%5B-118.291511%2C33.8726%5D%2C%5B-118.2877349%2C33.87326%5D%2C%5B-118.286018%2C33.8764%5D%2C%5B-118.288421%2C33.898631%5D%2C%5B-118.28910%2C33.91373%5D%2C%5B-118.28292%2C33.9222808%5D%2C%5B-118.2818%2C33.9276%5D%2C%5B-118.290481%2C33.92883%5D%2C%5B-118.300094%2C33.92655%5D%2C%5B-118.31176%2C33.924559%5D%2C%5B-118.3203%2C33.924559%5D%2C%5B-118.33030%2C33.922850%5D%2C%5B-118.340606%2C33.92683%5D%2C%5B-118.35433%2C33.933390%5D%2C%5B-118.368072%2C33.928548%5D%5D%2C%5B%5B-118.352966%2C33.916013%5D%2C%5B-118.352279%2C33.902051%5D%2C%5B-118.32824%2C33.90319%5D%2C%5B-118.326873%2C33.916013113401696%5D%2C%5B-118.352966%2C33.916013%5D%5D%2C%5B%5B-118.343696%2C33.887232%5D%2C%5B-118.34378%2C33.87775%5D%2C%5B-118.318033%2C33.8872%5D%2C%5B-118.343696%2C33.887232%5D%5D%5D%7D%7D&apiKey=YOUR_API_KEY- gray out map except for an area with GeoJSON:
https://maps.geoapify.com/v1/staticmap?style=osm-bright&width=600&height=400&area=rect:2.2158050537109375,48.8032455364465,2.470550537109375,48.911218476584025&geojson=%7B%22type%22%3A%22Feature%22%2C%22properties%22%3A%7B%22fillcolor%22%3A%22%23000%22%2C%22fillopacity%22%3A0.7%7D%2C%22geometry%22%3A%7B%22type%22%3A%22Polygon%22%2C%22coordinates%22%3A%5B%5B%5B2.19142913%2C48.7822111%5D%2C%5B2.50350952%2C48.7822111%5D%2C%5B2.50350952%2C48.9441512%5D%2C%5B2.19142913%2C48.9441512%5D%2C%5B2.19142913%2C48.7822111%5D%5D%2C%5B%5B2.30781%2C48.8956%5D%2C%5B2.29373%2C48.89022%5D%2C%5B2.2837%2C48.882%5D%2C%5B2.25254%2C48.8522%5D%2C%5B2.25528%2C48.8466%5D%2C%5B2.2539%2C48.8389%5D%2C%5B2.2607%2C48.8355%5D%2C%5B2.271%2C48.8351%5D%2C%5B2.3263%2C48.8202%5D%2C%5B2.3359%2C48.8174%5D%2C%5B2.35107%2C48.8177%5D%2C%5B2.36309%2C48.8172%5D%2C%5B2.3778%2C48.82266%5D%2C%5B2.4094%2C48.8355%5D%2C%5B2.41458%2C48.8516%5D%2C%5B2.41081%2C48.8651%5D%2C%5B2.4132%2C48.8692%5D%2C%5B2.40772%2C48.87961%5D%2C%5B2.39776%2C48.8843%5D%2C%5B2.3912%2C48.9006%5D%2C%5B2.3191%2C48.8999%5D%2C%5B2.30781%2C48.8956%5D%5D%5D%7D%7D&marker=lonlat:2.3494655661542367,48.85774273910704;type:awesome;color:%2319b8fc;size:large&apiKey=YOUR_API_KEY- Here's an example of customizing map style for a more tailored map appearance:
https://maps.geoapify.com/v1/staticmap?style=klokantech-basic&width=600&height=400¢er=lonlat:14.413116,50.088028&zoom=15.2825&styleCustomization=background:%23d2cebf|landcover_grass:%23a6b390|park:%23bed09d|landcover_wood:%2391a56d|water:%2397afc0|landuse:%236c593a|landuse_overlay_national_park:%237b8936|waterway:none|building:%23a89e8b|housenumber:%23e2dad3|road_bridge_area:%23ffffff&apiKey=YOUR_API_KEYWhat's next
- Learn more about the Geoapify Static Maps API >>
- Visit the Static Map Documentation page for API specifications >>
- Geoapify Static Maps API Playground >>
- Get a Geoapify API key and start using the Static Maps
