


Geospatial data is the foundation of digital maps, navigation, and spatial analysis, capturing locations, patterns, and relationships. It helps us understand and interact with the world, from urban planning to environmental monitoring.
Geospatial data can be categorized in different ways, but two primary distinctions define its structure and behavior:
- Vector vs. Raster Data – This classification differentiates between data that represents precise geographic features using geometric shapes (vector) and data that captures continuous spatial information in a grid format (raster).
- Static vs. Dynamic Data – This distinction focuses on whether geospatial data remains unchanged over time (static) or evolves due to real-time updates or historical trends (dynamic).
Understanding these types is essential for effective mapping, analysis, and decision-making. Explore Geoapify to discover tools that transform geospatial data into actionable insights.
Vector vs. Raster Data
Geospatial data is primarily structured in two formats: vector and raster. Each serves a distinct purpose, depending on the type of spatial information being represented and how it is used in mapping, analysis, and decision-making.
Vector Data: Precise Geographic Features
Vector data represents discrete objects and well-defined locations using points, lines, and polygons. It is commonly used in applications that require precise boundaries and detailed spatial relationships.
- Points – Represent specific locations without size or shape.
- Examples: City locations, ATMs, Wi-Fi hotspots, weather stations.
- Lines – Represent linear features connecting multiple points.
- Examples: Roads, railways, rivers, hiking trails, power lines.
- Polygons – Represent enclosed areas with defined boundaries.
- Examples: Country borders, land parcels, lakes, administrative zones.
Use Cases of Vector Data:
- Urban planning and zoning maps.
- Road network analysis for navigation apps.
- Property mapping and land use classification.
- Geocoding (matching addresses to geographic coordinates).
Common Vector Data Formats:
- Shapefile (.shp, .shx, .dbf) – A widely used format in GIS, storing geometric and attribute data separately. More details can be found on Wikipedia.
- GeoJSON (.geojson) – A JSON-based format for web mapping and APIs. Learn more in the Geoapify Guide or on GeoJSON.org.
- Example:
{
  "type": "FeatureCollection",
  "features": [
    {
      "type": "Feature",
      "geometry": {
        "type": "Point",
        "coordinates": [12.4924, 41.8902]
      },
      "properties": {
        "name": "Colosseum",
        "city": "Rome"
      }
    }
  ]
}
- Example:
- KML (Keyhole Markup Language, .kml) – Used for geographic visualization in Google Earth and similar applications. You can read more about it on Wikipedia.
- Example:
<Placemark>
  <name>Eiffel Tower</name>
  <Point>
    <coordinates>2.2945,48.8584,0</coordinates>
  </Point>
</Placemark>
- Example:
- GPKG (GeoPackage, .gpkg) – A modern, SQLite-based GIS format supporting vector and raster data. The official OGC Standard provides more details.
- CSV (Comma-Separated Values, .csv) – Often used for storing point data with latitude/longitude coordinates.
- Example:
name,latitude,longitude
Statue of Liberty,40.6892,-74.0445
Big Ben,51.5007,-0.1246
- Example:
- DXF (Drawing Exchange Format, .dxf) – A format for CAD and GIS applications, used to store vector drawings. More information is available in the Autodesk DXF Wiki page.
- WKT (Well-Known Text) & WKB (Well-Known Binary) – Text and binary representations of vector geometries, commonly used in databases.
- Example (WKT):
POINT(13.4050 52.5200)
- Example (WKT):
- TopoJSON (.topojson) – An extension of GeoJSON that reduces file size by encoding topology. You can find more information on TopoJSON.org.
Each format has its own strengths, depending on file size efficiency, software compatibility, and required data complexity.
Raster Data: Continuous Spatial Information
Raster data consists of a grid of pixels (cells), where each pixel stores a value representing a specific geographic attribute. This format is ideal for representing continuous surfaces, environmental data, and imagery.
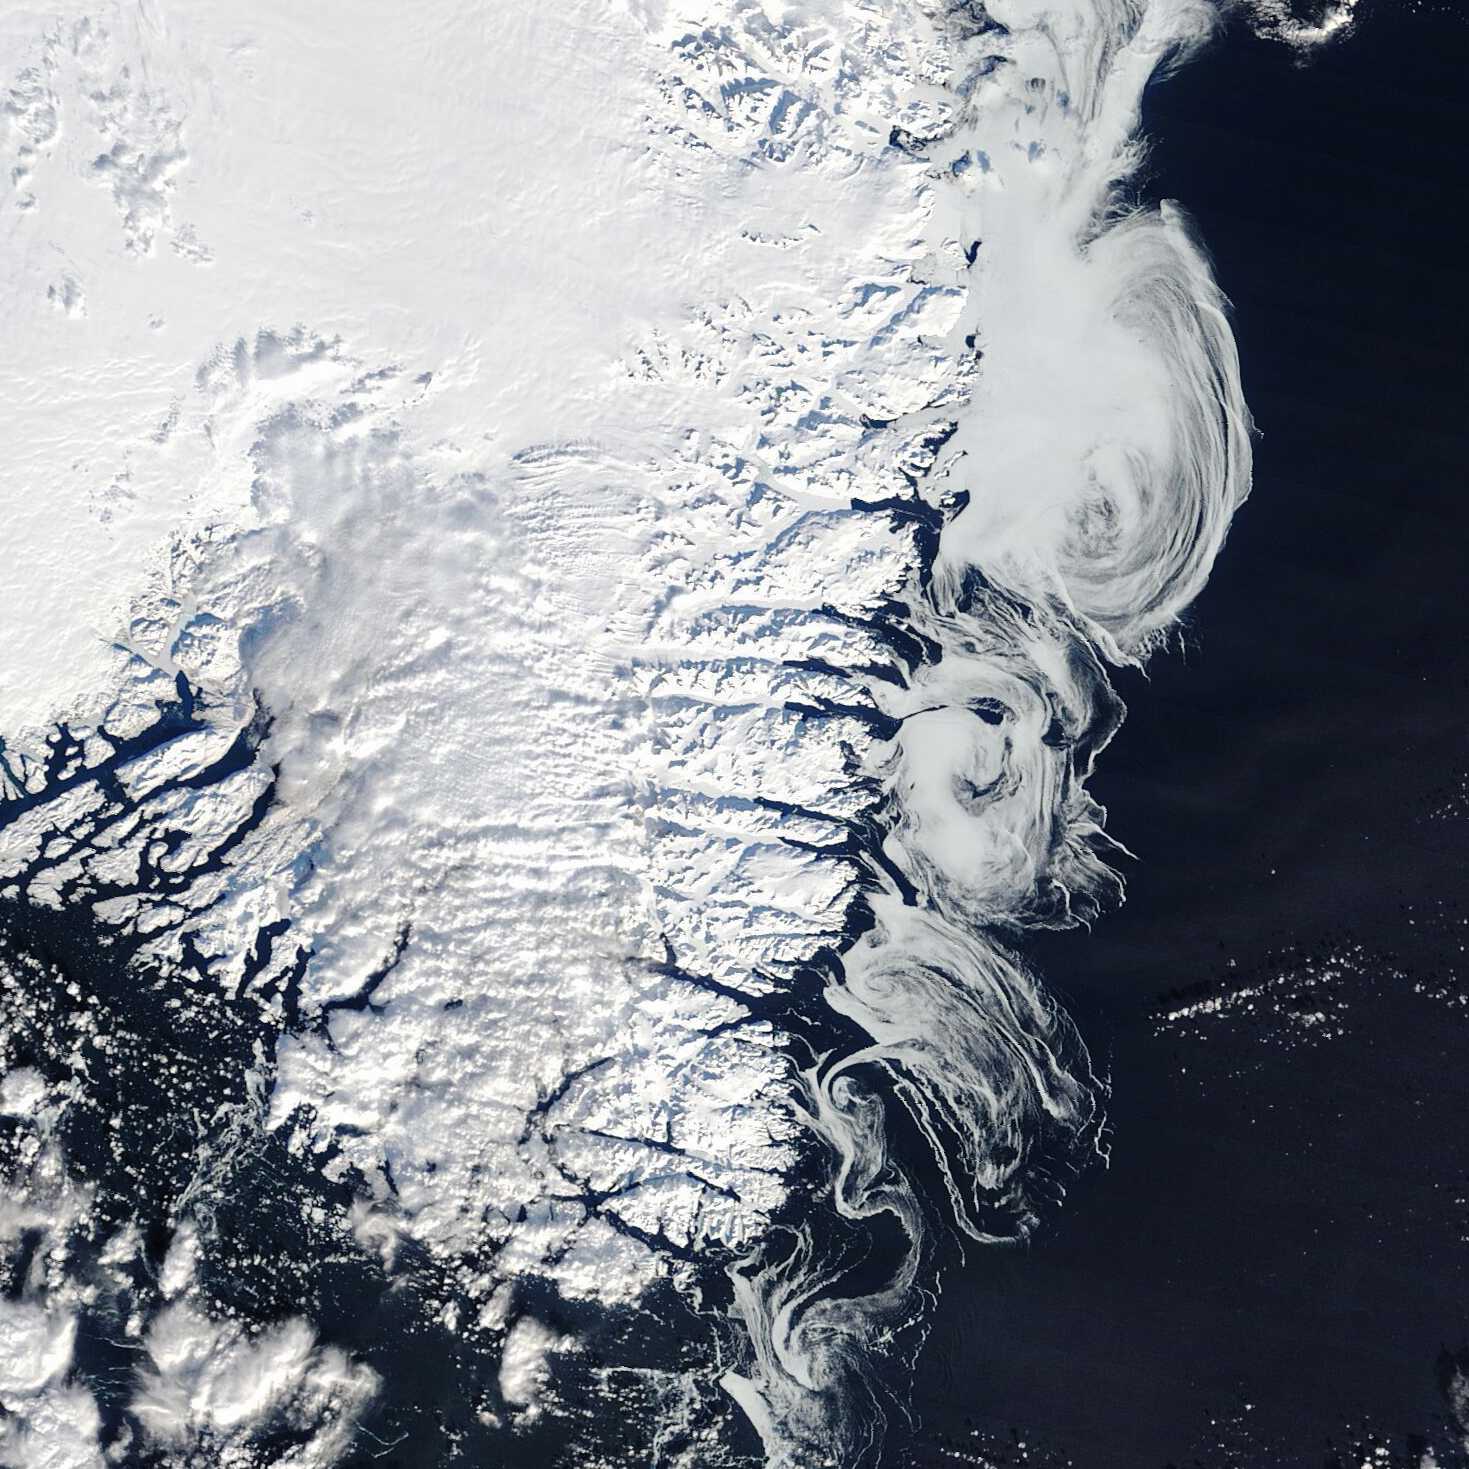
- Satellite imagery provides large-scale views of Earth's surface, making it essential for environmental monitoring, land-use analysis, and disaster response. Platforms like Google Earth and NASA Earth Observatory offer access to satellite scans and remote sensing data.
-
Aerial photography captures high-resolution images from aircraft or drones, offering detailed visual data for applications such as urban mapping, disaster assessment, and forestry analysis. The USGS National Map provides extensive aerial imagery resources.
-
Digital Elevation Models (DEM) represent terrain elevations and landforms, commonly used in 3D terrain modeling, flood risk analysis, and mountain topography studies. More details and datasets are available through the USGS 3D Elevation Program.
-
Thematic raster data represents non-visual spatial information such as temperature distribution, precipitation levels, and population density. The Copernicus Climate Data Store provides extensive datasets for climate and environmental research.
Use Cases of Raster Data:
- Weather forecasting and climate change studies.
- Agricultural monitoring and crop health analysis.
- Disaster response (wildfire tracking, flood prediction).
- Land cover classification (urban expansion, deforestation).
Common Raster Data Formats:
-
GeoTIFF (.tif, .tiff) is a widely used format for storing high-quality geospatial imagery and elevation data, supporting metadata and multiple bands. More details can be found on the GeoTIFF official site.
-
JPEG2000 (.jp2) offers a compressed raster format optimized for satellite imagery and aerial photography, providing high-resolution data with reduced file size. Learn more from the JPEG2000 standard.
-
NetCDF (.nc) is primarily used for climate and meteorological data storage, supporting multidimensional datasets for atmospheric and oceanographic research. Additional information is available on the UCAR NetCDF Overview.
-
Erdas Imagine (.img) is a proprietary format developed by Hexagon Geospatial, widely used for remote sensing and GIS applications, particularly for large raster datasets. More details can be found on Hexagon’s website.
-
HDF (Hierarchical Data Format, .hdf) is designed for scientific datasets, commonly used in remote sensing and NASA’s Earth science applications. Learn more from the HDF Group.
-
BigTIFF (.tif, .btiff) is an extension of GeoTIFF that allows handling of extremely large raster files beyond the 4GB limit, making it ideal for high-resolution satellite imagery. The OSGeo project provides more information.
-
GRIB (Gridded Binary, .grb, .grib2) is widely used for weather forecasting and meteorological data storage, efficiently compressing and transmitting large-scale atmospheric models. Details are available from the WMO GRIB standard.
-
ASCII Grid (.asc, .grd) is a simple text-based format for storing elevation and raster grid data, often used in GIS applications for terrain modeling. More details can be found on the GDAL documentation.
Each of these formats is optimized for specific raster data applications, from satellite imagery and elevation models to climate data and scientific computing.
Key Differences Between Vector and Raster Data
| Feature | Vector Data | Raster Data |
|---|---|---|
| Structure | Defined by points, lines, and polygons | Composed of a grid of pixels (cells) |
| Best suited for | Representing boundaries, infrastructure, and specific locations | Depicting continuous surfaces and environmental patterns |
| Typical applications | - Road and transportation networks - Administrative boundaries and zoning - Land parcel and property mapping - Utility and infrastructure management - Navigation and geocoding services | - Satellite and aerial imagery - Digital elevation and terrain models - Climate and weather forecasting - Land cover and vegetation analysis - Environmental and disaster monitoring |
| Common formats | Shapefile, GeoJSON, KML, GPKG, DXF, CSV, WKT, WKB, TopoJSON | GeoTIFF, JPEG2000, NetCDF, HDF, GRIB, BigTIFF, Erdas Imagine (.img), ASCII Grid (.asc, .grd) |
Both vector and raster data play a critical role in geospatial analysis. While vector data is preferred for precise features like roads and administrative boundaries, raster data excels in capturing large-scale environmental patterns and changes over time.
In the next section, we’ll explore how geospatial data can be categorized as static or dynamic, depending on whether it remains unchanged or evolves over time.
Static vs. Dynamic Geospatial Data
Geospatial data can be classified based on how it changes over time. While static data remains mostly unchanged, dynamic data evolves due to real-time updates, seasonal shifts, or historical trends. Understanding this distinction is crucial for applications ranging from urban planning to disaster response.
Static Geospatial Data
Static data represents spatial information that remains constant or changes very slowly over time. It is commonly used for reference, long-term planning, and baseline mapping.
Examples of static geospatial data:
- Topographic maps showing mountains, rivers, and other permanent physical features. You can explore global topographic data through the USGS National Map and NASA SRTM.
- Administrative boundaries such as country borders, city limits, and land parcels. Open datasets are available through Natural Earth and GADM.
- Cadastral data with property lines, ownership records, and zoning information, often provided by government agencies like USGS and national land registries.
- Geological maps illustrating soil types, rock formations, and tectonic structures. Global geological datasets are accessible via the OneGeology portal and USGS Earth Explorer.
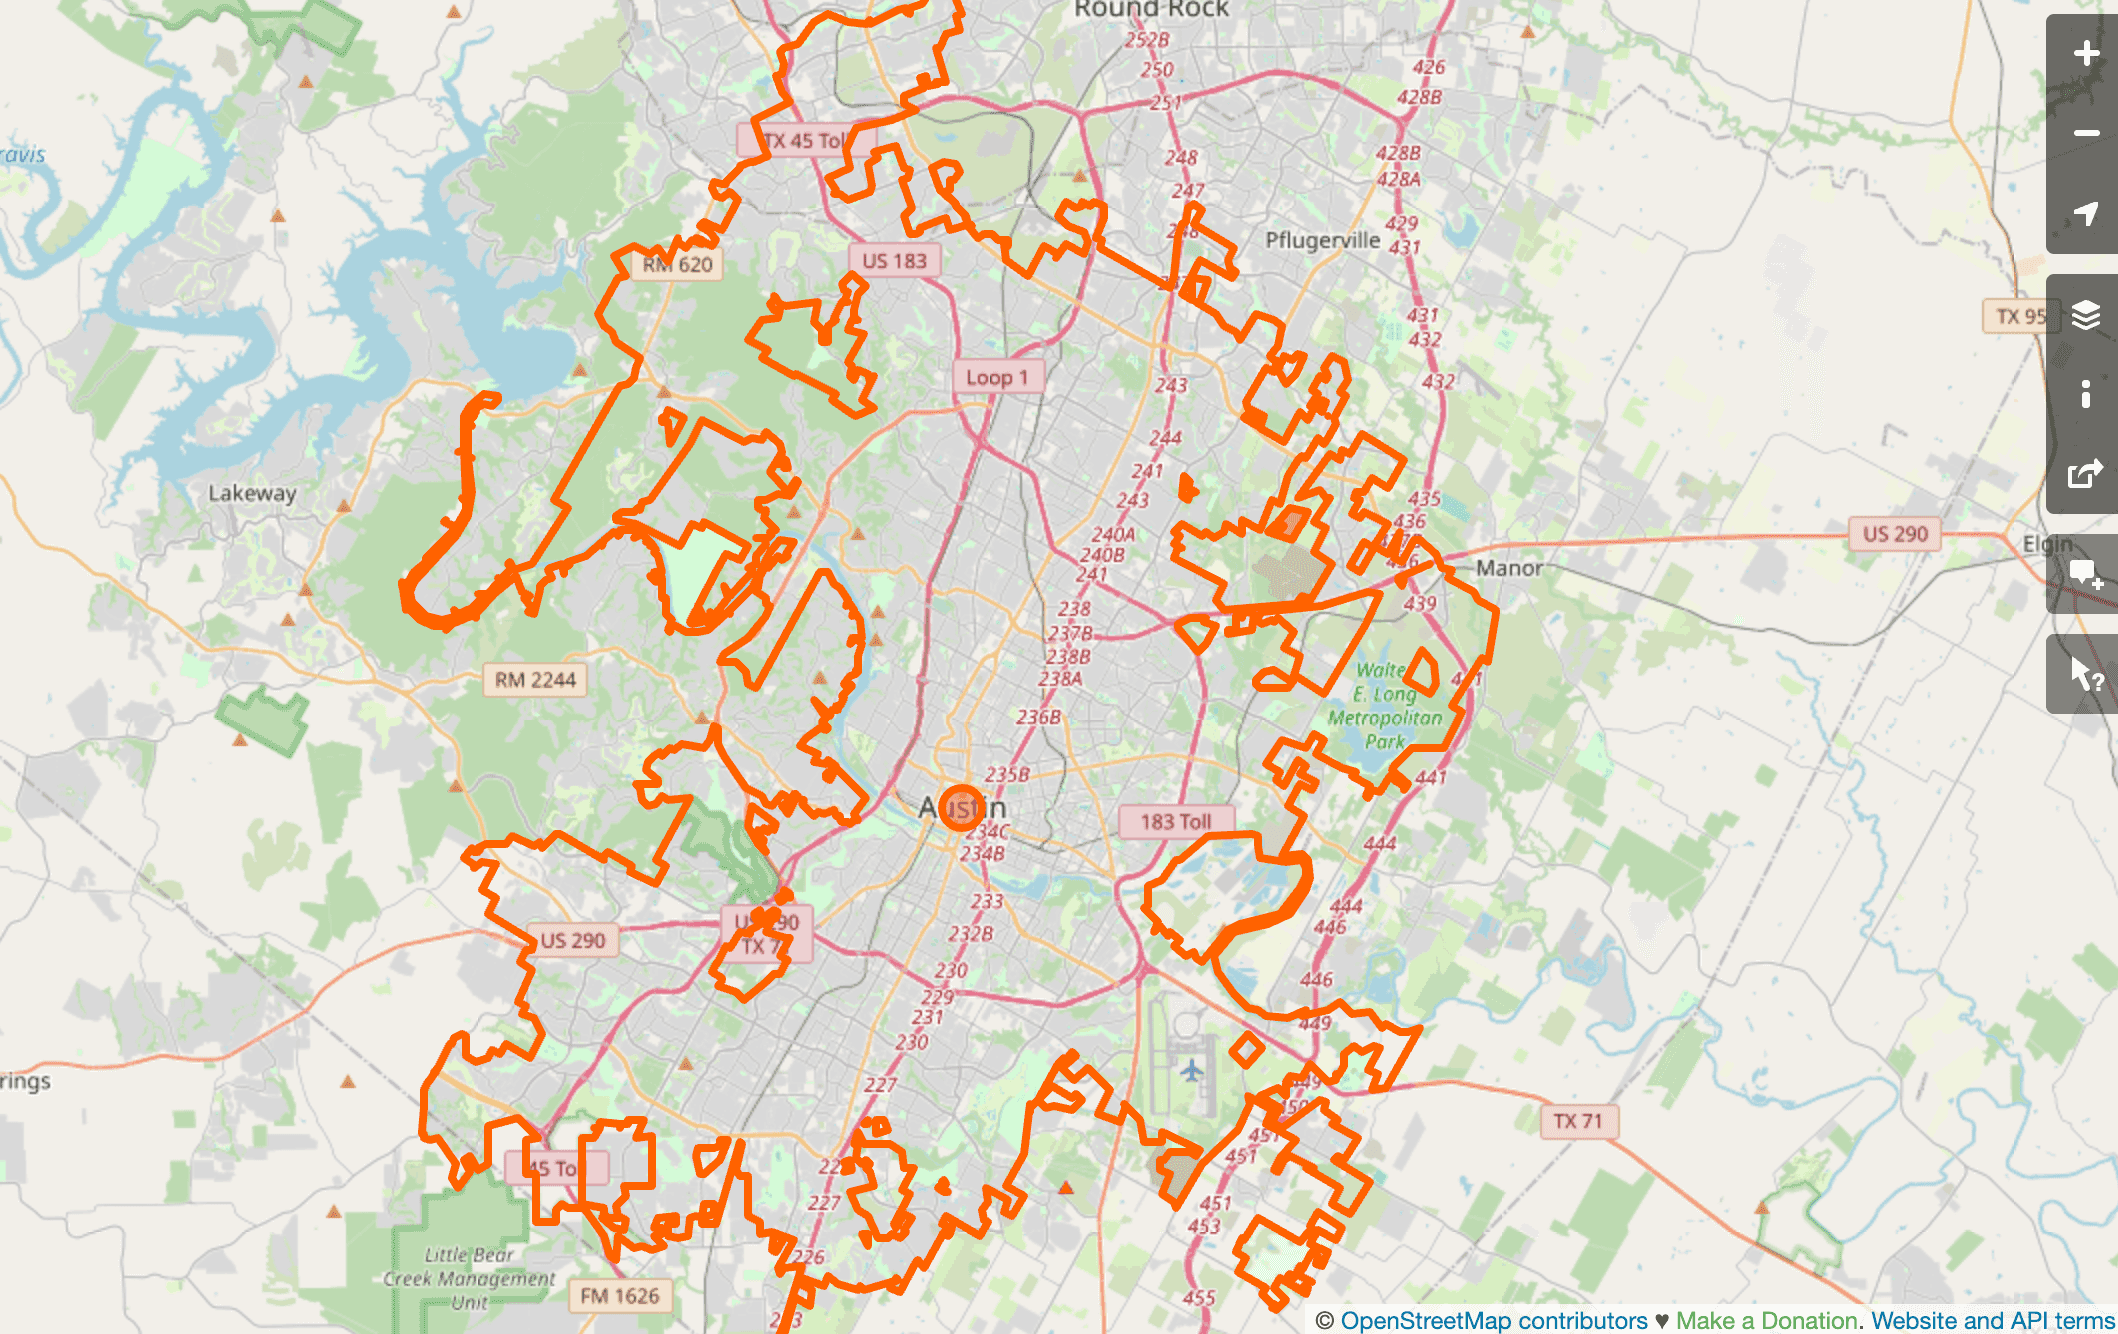
- Street maps with road layouts, intersections, and landmarks. Open data from OpenStreetMap provides freely available and continuously updated global mapping information. You can explore it on OpenStreetMap.org.
- Baseline LiDAR data capturing precise 3D elevation models for urban planning and infrastructure, with datasets available from NOAA and OpenTopography.
Static data is widely used in GIS databases, government records, and infrastructure projects. It supports applications like land use planning, environmental research, and navigation systems.
Dynamic Geospatial Data
Dynamic data represents spatial information that changes frequently due to real-time updates, seasonal variations, or long-term shifts. This type of data is essential for monitoring, predictive analysis, and time-sensitive decision-making.
Examples of dynamic geospatial data:
- Real-time GPS tracking of vehicles, aircraft, ships, and mobile devices, with global tracking data available from AIS MarineTraffic and Flightradar24.
- Traffic and road conditions that update based on congestion, accidents, and construction, accessible via Google Maps Traffic and TomTom Traffic.
- Weather data such as temperature, precipitation, and storm tracking, provided by NOAA and the Copernicus Climate Change Service.
- Satellite imagery showing changes in land cover, deforestation, and urban expansion. Real-time and historical images can be accessed through NASA Worldview and Google Earth Engine.
- Sea ice monitoring capturing seasonal variations and climate-related shifts, available from the NSIDC and Copernicus Marine Service.
- Air quality and pollution levels measured through sensor networks, with live data available on the World Air Quality Index and NASA’s Air Quality Monitoring.
- Real-time LiDAR scanning for autonomous vehicles, smart cities, and disaster assessment, with research data provided by NASA GEDI and OpenTopography.
- OpenStreetMap (OSM) live updates where volunteers and automated systems continuously add and update features like roads, buildings, and points of interest. You can explore real-time changes on OpenStreetMap.
Dynamic data is widely used in applications that require up-to-date information, such as disaster response, smart city solutions, and autonomous vehicle navigation.
Choosing Between Static and Dynamic Data
The choice between static and dynamic geospatial data depends on the application:
| Application | Static Geospatial Data | Dynamic Geospatial Data |
|---|---|---|
| Long-term reference and planning | Provides a stable and reliable foundation for urban planning, land use, and infrastructure development. Resources include USGS National Map and Natural Earth. | Less relevant, as long-term planning requires consistent, unchanging datasets. |
| Real-time monitoring and decision-making | Useful for baseline comparisons but lacks real-time updates needed for immediate decision-making. | Ensures timely insights for applications like traffic monitoring, weather forecasting, and emergency response. Data sources include Google Traffic, NOAA Weather, and NASA Worldview. |
| Predictive analytics | Historical static data serves as a foundation for trend analysis. Examples include GADM boundary data and USGS historical maps. | Historical and real-time dynamic data combined with models help forecast future trends. Platforms like Copernicus Climate Change Service and NASA Earth Observatory provide valuable datasets. |
| Navigation and transportation | Static road maps provide a reference for routing, such as those from OpenStreetMap and TomTom Maps. | Live traffic updates improve route optimization and travel time estimates. Real-time navigation services include Google Maps and HERE Traffic. |
| Environmental monitoring | Long-term climate data helps track changes over decades. Sources include NOAA Climate Data and NASA’s SRTM elevation data. | Satellite imagery, weather data, and air quality measurements provide up-to-date insights. Real-time data is available from Copernicus Sentinel and NASA Air Quality Monitoring. |
| Disaster response | Baseline data supports disaster preparedness and risk assessment. Relevant sources include FEMA Flood Maps and USGS Earthquake Data. | Real-time tracking of wildfires, floods, and storms helps coordinate emergency actions. Platforms like GDACS and NASA FIRMS provide near-real-time updates. |
Modern GIS and mapping platforms integrate both static and dynamic data for comprehensive solutions. For example, navigation apps use static road maps combined with real-time traffic updates to optimize routes, while climate researchers rely on historical satellite imagery and current weather observations to track environmental changes.
By effectively leveraging both types of geospatial data, industries can enhance spatial analysis, improve decision-making, and better plan for the future.
Geoapify API: Access and Query Geospatial Data
Geoapify provides a suite of geospatial APIs that enable users to query, process, and retrieve location-based data efficiently. Whether you need address geocoding, routing, administrative boundaries, or place search, our APIs offer a seamless way to access geospatial information for various applications.
APIs for Querying Geospatial Data
Our APIs allow developers to retrieve and analyze geospatial data in multiple formats, including JSON, GeoJSON, and other vector formats. This makes it easy to integrate location-based insights into mapping applications, GIS tools, and business intelligence platforms.
Here is an example of Places API responce (GeoJSON format):
{
  "type": "FeatureCollection",
  "features": [
    {
      "type": "Feature",
      "properties": {
        "name": "Buttes Chaumont",
        "country": "France",
        "country_code": "fr",
        "region": "Metropolitan France",
        "state": "Ile-de-France",
        "city": "Paris",
        "postcode": "75019",
        "district": "Paris",
        "suburb": "19th Arrondissement",
        "city_block": "Quartier du Combat",
        "street": "Avenue Jacques de Liniers",
        "lon": 2.3812008,
        "lat": 48.8783961,
        "state_code": "IDF",
        "state_COG": "11",
        "formatted": "Buttes Chaumont, Avenue Jacques de Liniers, 75019 Paris, France",
        "address_line1": "Buttes Chaumont",
        "address_line2": "Avenue Jacques de Liniers, 75019 Paris, France",
        "categories": [
          "public_transport",
          "public_transport.subway"
        ],
        "details": [
          "details.facilities",
          "details.wiki_and_media"
        ],
        "datasource": {
          "sourcename": "openstreetmap",
          "attribution": "© OpenStreetMap contributors",
          "license": "Open Database License",
          "url": "https://www.openstreetmap.org/copyright"
        },
        "facilities": {
          "wheelchair": false
        },
        "wiki_and_media": {
          "wikidata": "Q1018164",
          "wikipedia": "fr:Buttes Chaumont (métro de Paris)"
        },
      },
      "geometry": {
        "type": "Point",
        "coordinates": [
          2.3812008,
          48.87839609972249
        ]
      }
    }
  ]
}
Key features of Geoapify APIs:
- Geocoding API – Convert addresses into geographic coordinates and vice versa. Learn more on our Geocoding API page.
- Places API – Search for locations, businesses, and points of interest. Explore details on our Places API page.
- Route Planner API – Calculate optimized routes for different transport modes. Check out our Route Planner API.
- Isoline API – Generate travel time and distance polygons. More information is available on our Isoline API page.
- Map Tiles API – Access customizable basemaps and overlays for web applications. Visit our Map Tiles API for details.
Geospatial Data in Downloadable Formats
In addition to API-based data retrieval, Geoapify offers downloadable geospatial datasets for offline analysis, GIS applications, and large-scale spatial modeling. These datasets include:
- Administrative boundaries such as country, state, and city borders.
- OpenStreetMap-based data including road networks and land use information.
- Point of Interest (POI) datasets for business, infrastructure, and tourism analysis.
To explore available datasets and download options, visit our Data Download page.
Geoapify makes it easy to integrate geospatial data into your projects with reliable APIs and ready-to-use datasets. Whether you need real-time geospatial queries or offline data processing, our solutions provide the flexibility and accuracy required for a wide range of applications.
Conclusion
Geospatial data is essential for modern mapping, analysis, and decision-making. It comes in different forms, including vector and raster formats, and can be classified as static or dynamic, depending on whether it changes over time. Understanding these distinctions is crucial for selecting the right data for applications such as urban planning, navigation, environmental monitoring, and disaster response.
How Geoapify Helps
Geoapify provides solutions for working with geospatial data through:
- APIs for querying geospatial data – Retrieve geolocation, routing, administrative boundaries, and points of interest in JSON, GeoJSON, and other vector formats.
- Downloadable datasets – Access administrative boundaries, road networks, and POI datasets for offline GIS analysis and large-scale spatial processing.
- Integration with GIS and mapping platforms – Use Geoapify’s data and APIs in various applications, from interactive maps to business intelligence tools.
By leveraging Geoapify’s services, developers and businesses can efficiently incorporate geospatial intelligence into their projects, gaining valuable insights from location-based data. Whether for real-time monitoring or long-term planning, Geoapify makes geospatial data accessible, accurate, and easy to use.
FAQ
What is geospatial data?
Geospatial data refers to any data that has a geographic component, meaning it is associated with a location on Earth. It can include coordinates, addresses, administrative boundaries, and topographical features.
What are the main types of geospatial data?
Geospatial data is categorized into vector data (points, lines, and polygons) and raster data (satellite imagery, elevation models, and grid-based datasets). Learn more about vector and raster data in this Wikipedia article.
What is the difference between vector and raster geospatial data?
Vector data represents discrete objects using points, lines, and polygons, while raster data consists of a grid of pixels representing continuous surfaces. More details can be found in the GDAL Vector Data Model documentation.
What are examples of vector geospatial data?
Vector geospatial data includes road networks, city boundaries, land parcel maps, and utility infrastructure. Common formats include GeoJSON, Shapefile, and KML. You can explore more about vector formats at Geoapify's GeoJSON Guide.
What are examples of raster geospatial data?
Raster geospatial data includes satellite imagery, digital elevation models (DEM), and climate heatmaps. Popular raster formats include GeoTIFF, NetCDF, and JPEG2000. Learn more from GeoTIFF's official documentation.
What is the difference between static and dynamic geospatial data?
Static geospatial data remains unchanged over time, such as topographic maps and administrative boundaries, whereas dynamic data changes frequently, such as live traffic updates and weather patterns. Read more on USGS geospatial data FAQ.
How is geospatial data used in real-world applications?
Geospatial data is used in navigation, logistics, urban planning, environmental monitoring, disaster response, and business intelligence for location-based insights. Learn more from NASA Earth Observatory.
What formats does Geoapify API support?
Geoapify APIs return data in JSON, GeoJSON, and other vector formats, making it easy to integrate with GIS platforms, web applications, and data analytics tools.
Does Geoapify offer downloadable geospatial data?
Yes, Geoapify provides downloadable datasets, including administrative boundaries, road networks, and points of interest (POI) for GIS analysis and offline processing. You can explore available datasets at Geoapify Data Download.
How can I use Geoapify APIs in my project?
You can integrate Geoapify APIs for geocoding, routing, places search, and spatial analysis by making API requests and retrieving structured location data for your application. Learn how to get started at Geoapify.
Where can I learn more about Geoapify's geospatial solutions?
Visit the Geoapify website to explore API documentation, use cases, and available datasets for enhancing your geospatial applications at Geoapify.